How to Actually Manage Risk in Trading (The Institutional Way)
Quant Trading
The complete framework institutions use instead of fixed dollar amounts and naive stop losses: volatility based position sizing, correlation adjusted notional, VaR and Conditional VaR limits, and a written trading mandate. Includes real numbers: a portfolio going from 9443 dollars of naive notional to 13400 dollars once correlation is accounted for, and a 20 percent target return with 10 percent volatility mandate for a Sharpe ratio of 2.
Antoine
CEO - CodeMarketLabs
2026-09-18
In the last video, I took apart pretty much everything retail trading teaches about risk: the fixed dollar amount per trade, the 2 percent rule, the stop loss treated as a guaranteed maximum loss, hidden leverage, and all the psychological folklore that comes with it. None of that is how risk is actually managed at institutions, or by anyone who trades serious size and makes real money doing it. So today we build the framework that replaces all of it, starting from the ground up.
What this article covers
Why position size should come from volatility, never from a fixed dollar amount or a fixed percentage.
A full worked example: turning a 1000 dollar annual risk budget into a position size and a leverage number.
How correlation between assets changes how much notional you can actually deploy, with real numbers.
Why the classic stop loss is a bad idea once your size gets real, and what to use instead.
How to build a trading mandate: target return, target volatility, max drawdown, VaR, and Conditional VaR.
What data you need to actually run this framework, and where to get it.
1. Size Your Position With Volatility, Not With a Fixed Amount
Sizing a position based on volatility means you never decide upfront to risk a fixed dollar amount, and you never risk a fixed percentage of your account either. The amount you put on a trade, in notional, is determined by the risk of that specific asset, measured by its volatility. In practice, this means you first define an annual risk budget for your whole portfolio or trading account, whatever you want to call it, they are the same thing. Say your risk budget is 20 percent of your portfolio. Every position size you take from that point on flows out of that single number.
Here is how it works with real numbers. Take a trader with a small account who is starting out. He sets a target volatility, meaning how much his portfolio is allowed to swing per year, at 20 percent of his capital. That gives a total annual risk budget of 1000 dollars: he is comfortable seeing his portfolio move 1000 dollars in either direction over a year. Now say he trades EUR/USD only, putting 100 percent of his capital on that single pair. If EUR/USD has an annualized volatility of about 7.7 percent, dividing the 1000 dollar risk budget by that volatility gives a notional of roughly 13000 dollars. Since this is a single asset, there is no correlation adjustment to make, so the final notional matches: about 13000 dollars, for a total leverage of 2.60.
Push the risk budget to 30 percent of capital and the notional grows to roughly 19500 dollars, with leverage climbing to about 3.90, which already starts to feel high. Push it to 50 percent, meaning you are willing to see half your capital swing in a year, and you get to around 39000 dollars of notional with leverage near 6.51. The position size is never arbitrary. It is a direct, mechanical output of the risk budget you chose and the volatility of the asset you are trading.
2. Correlation Changes How Much Risk Budget You Actually Have
Single asset sizing is the easy case. The moment you hold more than one position, correlation between the assets changes how much total notional you can deploy for the same risk budget. Take a trader with equal conviction on EUR/USD and the S&P 500, allocating 50 percent of the risk budget to each. If you size both naively, treating them as independent risks, each gets 500 dollars of risk, for a naive total notional of about 9443 dollars combined. But EUR/USD and the S&P 500 are barely correlated. Once you adjust the notional for that correlation, an adjustment factor of about 1.42 in this case, you can actually deploy more notional on each leg for the same overall risk. The correlation adjusted total comes out to roughly 13400 dollars instead of 9443.
The gap between those two numbers is the point. If you size EUR/USD and the S&P 500 naively, as most retail frameworks tell you to, you are leaving about 295 dollars of usable risk budget on the table, which is roughly 30 percent of what you could actually deploy. Because the two assets move independently of each other, the combined position swings less than the sum of its parts would suggest, and your risk budget should reflect that.
var-cvar-distribution-diagram
The effect can go the other way too. Take EUR/USD at 55 percent conviction and USD/CAD at 45 percent conviction, both currency pairs, which admittedly share the US dollar and is a slightly artificial example, but it illustrates the point well. Sized naively at 550 dollars and 450 dollars of risk respectively, the combined notional comes out to about 14512 dollars, higher than the equities example simply because currency pairs are less volatile than the S&P 500. Once adjusted for correlation, that number jumps to roughly 31000 dollars, for a total leverage near 6.31. The reason is that EUR/USD and USD/CAD are negatively correlated: since the US dollar sits on both sides, the two pairs tend to move in opposite directions. That negative correlation means combining them barely adds any net risk, even though it is a financially strange trade to put on in the first place. The broader lesson holds regardless: size with the volatility of your assets and their correlation to each other, never with a flat budget like 500 dollars per trade regardless of what you are trading.
3. Forget the Stop Loss, Define an Invalidation Level Instead
The YouTube version of a stop loss is simple: place it at a technical or fundamental level and stick to it no matter what. That is not how this works once your size is real. If you run a 200 million dollar position with a resting stop loss in the order book, the moment price approaches that level you create a hole in the market. Either you get a brutal slippage event, or algorithms detect a large resting order at a specific price and push volume in your direction on purpose to trigger it, then trade against you once it fills. Nobody who trades serious size uses naive resting stops for this reason, unless the order is hidden and sliced into many smaller pieces.
The real approach is to always have an invalidation level for your thesis in mind, not a stop loss. If price reaches that level, your thesis is invalidated and you exit, but you manage that exit, you do not let a naive resting order get run over by an overnight gap or a liquidity grab right as your thesis breaks. You can even plan the response in advance: for example, if the market reaches a certain level your thesis is not fully invalidated yet but weakened, so you cut the position to half its maximum risk rather than closing it outright, and reduce further from there if needed.
The reliance on a hard stop loss usually traces back to psychology rather than strategy: telling yourself that if your position is 1000 dollars, placing a stop guarantees you only lose 1000. In reality you are not guaranteed that at all, and the stop is often poorly placed to begin with. If you feel you need a stop loss to sleep at night or to enjoy your life while holding a position, that is a signal your sizing is wrong at the root, not that you need a better stop. Fix the sizing, using the volatility based approach above, and the need for a naive stop loss on a chart largely disappears.
4. Separate Risk Management From Trading With a Written Mandate
Separating risk management from trading decisions is genuinely the hardest part, and it stays complex even for professional traders, because you are the one judging your own trades. The starting point is to determine your mandate. As an example, a mandate might target 20 percent annual return with a maximum volatility of 10 percent per year, which gives a Sharpe ratio of 2, on par with some of the best hedge funds. Once that mandate exists, the job becomes respecting its risk budget, keeping in mind that volatility and correlations are not constant over time and need to be reassessed regularly.
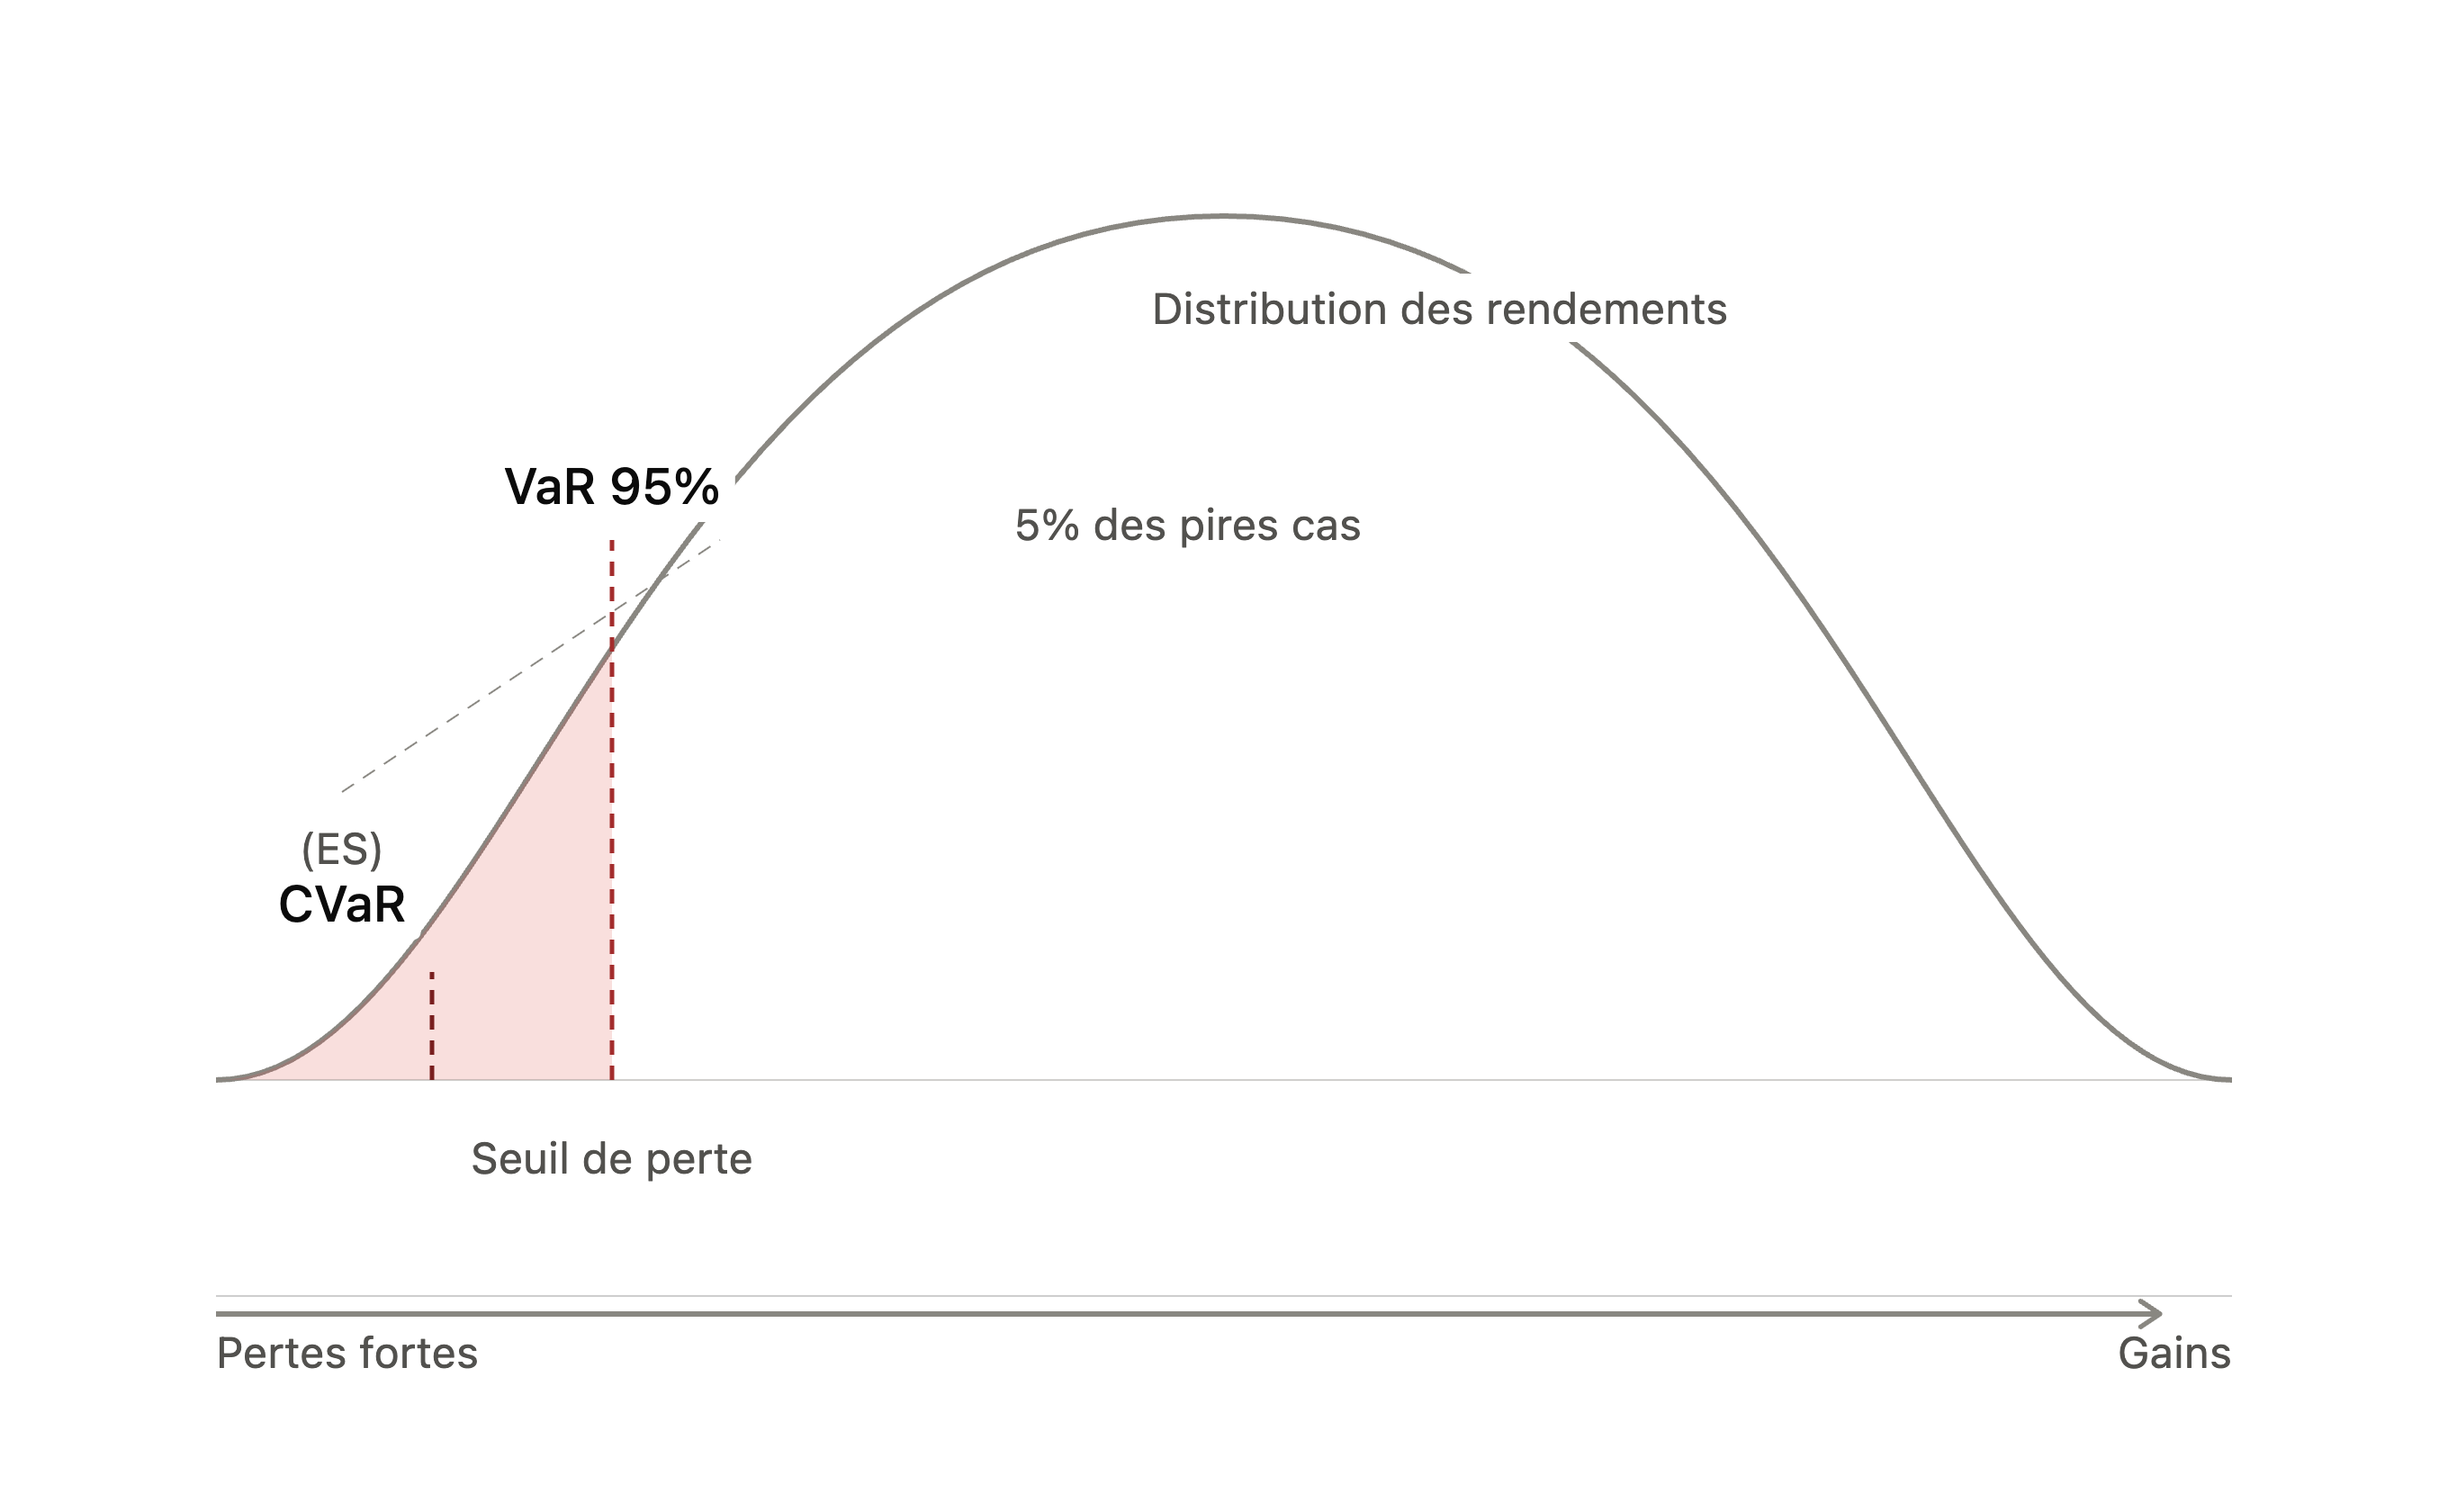
On top of the mandate, set a maximum drawdown for the whole strategy, for example 20 percent. If that level is touched, a decision is made in advance rather than in the moment: cutting all positions in half, or closing everything entirely. The same applies to Value at Risk, the maximum loss your portfolio could take over a given time horizon with a given probability. As an example, a VaR limit might state that the portfolio should not lose more than 15000 dollars over 10 days with 99 percent probability. This is statistical, so it can be breached; if models were perfect there would never have been a bank failure. Still, know your VaR and think in terms of whether adding a given trade or position would push you past it. If it would, the trade simply does not go on.
A third limit worth tracking is Conditional Value at Risk, also known as Expected Shortfall: if your VaR threshold is breached, what is the average loss you would take beyond that point. This number should be tracked on the portfolio at all times, and the limit set for it should not be exceeded. On top of all this, set limits per contract, per instrument, and per asset class in advance, based on the volatility of each, and revisit those limits regularly since volatility itself changes over time. For example, cap total notional on commodities, on equities, on bonds, and on FX individually rather than treating the whole portfolio as one undifferentiated pool.
Write the entire mandate down once, properly, before doing anything else. Then check it every day and before every trade you take while in a position. If a limit is breached, the response is simple: reduce your positions. This is genuinely more complex than the retail version, precisely because it is qualitative rather than a single number pasted on a chart, so expect to think it through carefully, using AI tools or your own experience depending on where you currently stand.
5. The Data You Actually Need to Run This
To put this framework into practice you need at minimum a price history for every asset you trade, so you can build a return history, daily if you trade daily, 5 minute if that is your timeframe, and so on. From that return history you can calculate your Conditional VaR, your VaR, your current drawdown, and the realized volatility of each asset, including a rolling 30 day realized volatility to decide whether a position needs to be cut. Interactive Brokers provides this kind of history if that is your broker, Yahoo Finance is another source, and for equities specifically MStock, which is my own tool, gives over 30 years of history. Interactive Brokers also outputs a Value at Risk report directly, so you do not necessarily need to calculate it yourself from scratch.
Once you have that data pipeline in place, write down every risk rule that applies to your strategy or your trading, what you will and will not do, once and for all. From there you have your metrics, your limits, your sizing per asset, and you know how to size properly. At that point you are ready to trade and simply respect the limits you set. It really is that mechanical once the framework is built.
Do I need an institutional-size account for volatility based sizing to make sense?
No, the logic scales down. The worked example in this article uses a 1000 dollar annual risk budget on a small account. The mechanics are identical whether your risk budget is 1000 dollars or 1 million, only the notional and leverage numbers change.
Can I really trade without any stop loss at all?
The point is not to remove risk control, it is to replace a naive resting stop with a thesis invalidation level that you manage actively, often through partial reduction rather than a single hard exit. If your sizing is correct in the first place, the need for a naive stop loss mostly disappears.
Where do I get correlation data between the assets I trade?
You can build it yourself from historical return series using the same sources mentioned for price history, Interactive Brokers, Yahoo Finance, or MStock for equities, then compute a rolling correlation matrix across your traded assets.
What is the practical difference between VaR and Conditional VaR?
VaR tells you the maximum loss you should expect not to exceed at a given confidence level over a given horizon. Conditional VaR, or Expected Shortfall, tells you the average loss you would actually take if that VaR threshold gets breached, which is the number that matters once things go wrong.
How often should I recompute volatility and correlation for my sizing?
Regularly, since neither is constant. Many traders recompute realized volatility on a rolling basis, for example over the last 30 days, alongside a longer term average, and reassess correlations on a similar cadence rather than treating either as fixed.