How I Analyze Any Stock in Under 10 Minutes (Using Amazon)
Finance & Macro
A full walkthrough of the framework I use to analyze any company before investing: the 3 tools you need, how to read the business and its moat, the 4 charts that show profitability and growth, balance sheet and management quality checks, and a full peer valuation. Applied live to Amazon, PE 20.7x, EV to EBITDA 13x versus a 30x historical average, ROE between 13 and 20 percent, plus the one chart, EPS versus price, that changed how I invest.
Antoine
CEO - CodeMarketLabs
2026-09-25
I've been investing in stocks for years now, both personally and as part of my job, and if there is one thing that actually moves the needle on a portfolio's performance, it's knowing how to properly analyze a company. Friends constantly ask me what I think of a stock before they buy it, so in this piece I'm breaking down exactly how I analyze any company in under 10 minutes, using Amazon as the live example.
What this article covers
The 3 things you need before analyzing any stock: an AI model, a 20 to 30 year data provider, and full earnings call history.
How to read a business model and its moat, applied live to Amazon.
The 4 charts that tell you whether a company is profitable and growing: revenue, margins, EPS, and ROE.
How to check balance sheet quality and management credibility.
How to value a stock against its peers: price to sales, EV to EBITDA, PEG, and EV to EBITDA versus margin.
The one chart that changed how I invest: EPS versus stock price, plus a real mispricing example.
1. The 3 Things You Need Before Analyzing Any Stock
First, you need a capable AI model. Gemini's or Claude's latest models are enough to help you synthesize a business, summarize a filing, or sanity check a thesis in seconds.
Second, you need a data provider with 20 to 30 years of history across every ratio that matters: PE, EV to EBITDA, full balance sheets, full income statements. This depth is not optional. If you only look at the last few years, you miss the full economic cycle, the last crisis, and the earnings call from 7 years ago where management said something they should not have and the stock dropped 30 percent.
Third, you need the company's full earnings call history, so you can read what management said quarter after quarter, what the guidance was, and whether they actually delivered on it next time around. If you hold a stock and never read its results when it reports, there is no real reason to hold it in the first place. Simply Wall Street, Investing.com, or any data provider works, but personally I use Mindstk, the tool I built myself, which covers 30 years of history with everything AI-commented on top.
2. Understanding the Business, and Its Moat
The first thing I look at when analyzing a company is simply the business: what does it actually do. Amazon is a global e-commerce and cloud computing giant, split into two very different businesses. There is retail, the part you order from and get frustrated with when the delivery is late, and there is AWS, the cloud computing arm you rent infrastructure from to build and host your models, sites, and applications. Reported segments are North America, International, and AWS, each with its own estimated growth rate. If you do not have access to a paid data provider, you can simply ask an AI model to break down a company's business segments and their growth for you.
The second thing to check is the moat. Does the company have captive customers who cannot easily leave for a competitor tomorrow morning, and does it convert those customers into recurring revenue with strong margins, strong returns on equity, and efficient management. A good moat means a solid customer base, a business competitors cannot easily destroy, and a management team that turns that solid base into real cash for shareholders and employees.
3. The Four Charts That Show Profitability and Growth
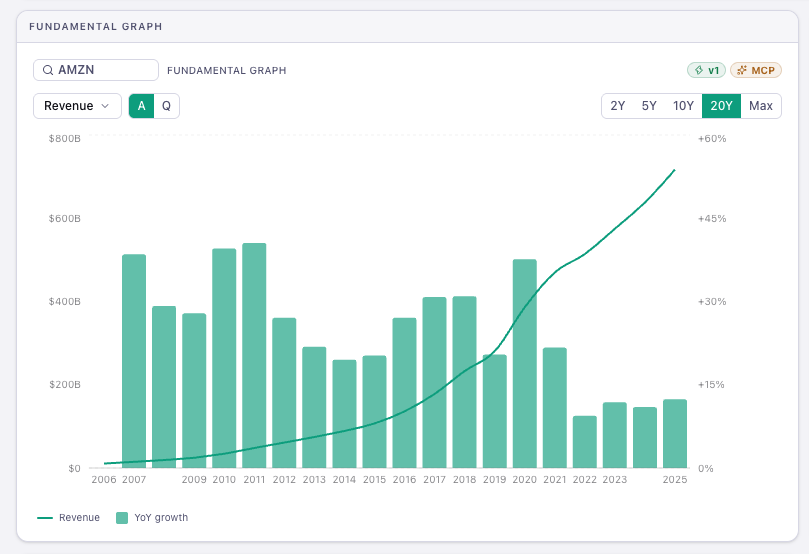
Once the business and moat are clear, I go into the numbers, and I look at four charts. The first is revenue, over the maximum available history. Amazon's revenue has grown almost continuously, with some seasonality if you zoom into quarterly data, but the trend is unmistakably up, even as growth has naturally slowed with the company's size.
amazon-revenue-growth-chart
The second chart is margins, again over 20 years. Amazon's margins have been climbing, and gross margin now sits around 50 percent, largely thanks to AWS.
The third chart is EPS growth. Early on, EPS growth was weak because the company was reinvesting heavily to expand. As time passes and AWS profitability keeps improving, EPS keeps getting stronger, which is exactly why understanding the moat and the business model matters: AWS is tech, so it is extremely profitable, while retail runs on thin margins to deliver everywhere in the world in under a day, with all the logistics that implies.
The fourth and last chart is return on equity. Outside of 2022, which was a genuinely bad year for Amazon, ROE has sat between 13 and 20 percent, which is a strong result.
4. Balance Sheet Quality and Management Credibility
Quality rests on two pillars for me. The first is balance sheet quality, starting with the debt ratio, specifically net debt to EBITDA. I personally consider a company with a very high net debt to EBITDA ratio too leveraged to be investable. Amazon sits at a low level here, even as capex accelerates, because the company is investing heavily to grow.
The second pillar is operating cash flow, which tells you whether the underlying activity itself burns capital or generates it. If a company's core activity destroys value instead of creating cash, that is a real problem. Amazon has no such issue: operating cash flow is enormous, and it moves almost as a mirror image of rising capex, which is why net debt to EBITDA has not really deteriorated even as investment has increased.
The second thing to check for quality is management credibility, which means going through the last several years of earnings calls. On Mindstk we pull these directly from the press conferences, with 10 years of history available for every company, including the guidance given each quarter and how the situation evolved afterward. Personally I export these as PDFs and read them on a plane, on a train, or whenever I am bored. What you are checking for is consistency: did management deliver on what it promised. A management team that tells you everything is great in Q1 2026 and then reveals negative free cash flow by Q4 is a real red flag, the equivalent of lending money to a friend you already know will never pay you back.
Putting all of that together on Amazon: the business and its moat are clear, profitability is strong with a solid ROE, revenue growth converts into earnings growth, the balance sheet has no real issue, and management's strategy is coherent, leaning into the AI and cloud boom through AWS while keeping retail as a lower margin but stable cash generator that also feeds a growing advertising business.
5. Valuation: Comparing Amazon to Its Peers
Once I am convinced a business is good, the real question becomes what price to pay for it. I build a peer watchlist, which is tricky for Amazon since it straddles two businesses: on the cloud side I compare it to Google, Oracle, Snowflake, and Microsoft, and on the retail side to Alibaba and Mercado Libre, since between them Amazon and Mercado Libre effectively dominate online retail in the West and Latin America, while Alibaba dominates Asia.
Against that peer average, Amazon's earning yield sits at roughly 4.8 percent versus a peer average of about 3.5 percent, making it nearly the best of the group after Google, with ROE in a similar exceptional range. On price to sales, Amazon trades at about 3.6 times against a sector average of roughly 6.7 times, meaning it is priced well below the group.
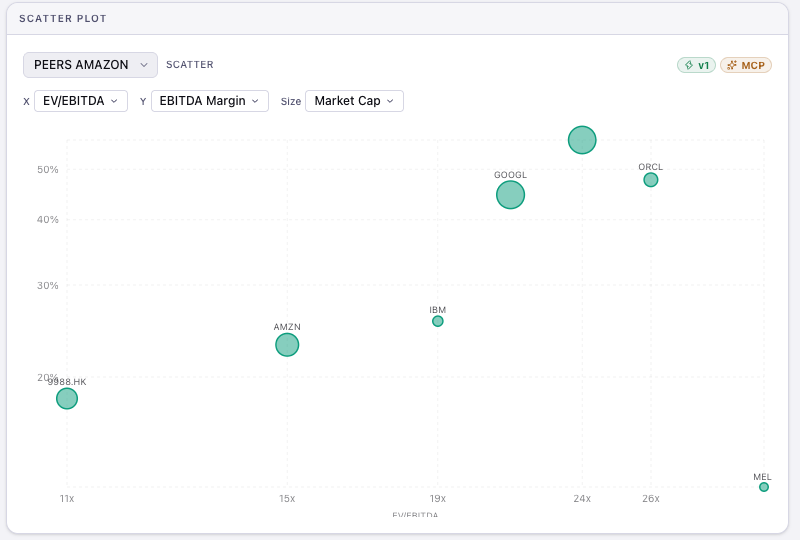
On EV to EBITDA, Amazon is the cheapest of the entire peer group, below Alibaba, Google, IBM, Mercado Libre, Microsoft, and Oracle. Looked at in isolation, a roughly 13 times EV to EBITDA and a 20.7 times PE look a bit rich, but once benchmarked against peers, that price stops looking expensive. On a PEG basis, factoring growth into the price, Amazon lands mid range, paying about 1.5 times earnings relative to growth and roughly 31.7 times trailing earnings.
amazon-peers-ev-ebitda-margin
The last valuation angle is comparing Amazon's current EV to EBITDA to its own history. The company has historically traded around 30 times EBITDA on average, and today it trades closer to 11 or 12 times, roughly half its historical average, excluding the 1998 period when EBITDA was negative and the ratio was not usable. Benchmarked against 36 large caps in the same sector, and against the broader US market, Amazon comes out cheaper on PE, price to book, price to sales, and EV to EBITDA, with a better ROE and better net and gross margins, and only slightly more leverage that remains very low in absolute terms.
6. The One Chart That Changed How I Invest
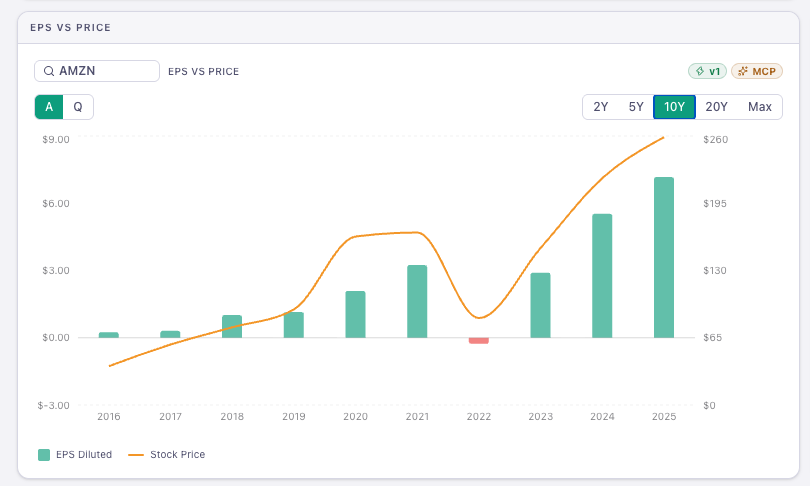
The last chart I look at is also my favorite: overlaying a company's earnings per share with its stock price over time. The idea is simple, price tends to follow EPS. A company that generates cash sees its stock rise, a company that does not sees it fall. Drawing trend lines on a chart, technical analysis, none of that matters, what matters is the fundamentals, meaning the stock price and the growth of EPS.
amazon-eps-vs-price-chart
For Amazon, the price has tracked EPS growth closely, which means the stock is fairly priced. The flip side is that this also means there is no obvious undervaluation gap left to close relative to its own earnings trajectory. Contrast that with Téléperformance in France, where EPS only dipped slightly but the market destroyed the stock, dividing the share price by roughly four, a real example of mispricing. This is not investment advice, but running this same exercise on a name like that is worth doing before assuming a beaten down stock is automatically cheap.
Do I need a paid data provider to run this kind of analysis?
No, you can combine an AI model with free sources like company filings and earnings call transcripts. A paid provider with 20 to 30 years of history simply makes the process much faster, which is why tools like Mindstk exist.
Why insist on 20 to 30 years of financial history instead of just the last few years?
Short histories hide the full economic cycle: past recessions, past crises, and past management mistakes that only show up over a longer window. Without that depth, you are analyzing a company without knowing how it behaves under stress.
What counts as a red flag on debt?
A net debt to EBITDA ratio that is unusually high for the sector is the first signal to check. Amazon stays at a low level here even as capex accelerates, because operating cash flow rises alongside its investments rather than lagging behind them.
Is Amazon expensive right now based on this analysis?
Looked at alone, a PE near 20.7 times and an EV to EBITDA near 13 times look a bit rich. Benchmarked against its peer group and its own 20 year history, where it has traded closer to 30 times EBITDA on average, the stock actually looks cheap rather than expensive.
What is a moat and why does it matter this much?
A moat is what keeps customers from easily switching to a competitor. It matters because it is what lets a company convert growth into durable margins and returns on equity instead of watching competitors erode its pricing power over time.
Is any of this financial advice?
No, this is an educational walkthrough of a personal analysis framework. Amazon and Téléperformance are used purely as examples to illustrate the method, not as recommendations to buy or sell.